|
City Interactive Map - Tutorial
The City Interactive Map is designed to display numerous map layers in one application, serving as a one-stop-shop for viewing City GIS information.
Our web map is supported across all modern web browsers including Edge, Chrome, Firefox, and Safari.
It is also supported on mobile devices like tablets and smartphones. The map requires no special software to install - it just works in your web browser.
This tutorial describes the layout and functionality of the City Interactive Map. It also walks through some How To Scenarios to demonstrate how to perform certain tasks.
|
PAGE LAYOUT: The City Interactive Map page is made up of three frames, listed below. The frames are resizable by using the horizontal  and vertical bars.
The frames are also expandable/collapsible using the small arrows and vertical bars.
The frames are also expandable/collapsible using the small arrows  in the upper right corner of the Control Panel frame and Search Results frame. in the upper right corner of the Control Panel frame and Search Results frame.
|
|
- The Control Panel frame contains the tools for turning on and off the display of map layers and basemaps, viewing the map legend, printing the map and performing measurements and searches.
These tools are contained within the following tabs:
- The Map frame contains the map, and additional tools for controlling the extents and location of the map, as well as a link to the tutorial document.
- The Search Results frame contains tabular results from performed searches.
|
|
|
CONTROL PANEL: The Control Panel has six separate tabs. Each tab has its own distinct functionality, which is highlighted below.
|
|
|
|
The Basemaps tab allows turning on and off basemap layers. Basemap layers serve as background reference layers, over which you lay operational layers.
- Basemaps are broken into two basemap types:
- Aerial - aerial photo basemaps
- Other - non-aerial basemaps
- Toggle buttons are avaiable, to provide additional functionality:
- Aerial Labels - turns on/off lables overtop any aerial layer.
- Local Historic - opens/closes the 'Local Historic - Time Slider' to allow switching between various years of local historic aerials.
- Google Tilt - turns on/off the Gloogle Tilt imagery, when the Google basemap layer is displayed. A rotate icon
 appears in the lower-right corner of the map to rotate the Tilt view when Google Tilt is enabled. appears in the lower-right corner of the map to rotate the Tilt view when Google Tilt is enabled.
- Users are limited to display only one basemap at a time.
- In addition, a link to our site Disclaimer / Terms of Use / Privacy Policy is also available from the basemaps tab.
|
|
Top
|
|
|
|
|
|
|
The Layers tab allows turning on and off map layers by clicking a checkbox.
- Layers are broken into three categories:
- City Utilities - layers owned and maintained by City Utilities
- Public Works - layers owned and maintained by Public Works
- Other - all other layers
- You can display any combination of layers on the map at any time.
- Layers shown with a lock icon
 in the list indicate internal-facing layers, which are not available to the public. in the list indicate internal-facing layers, which are not available to the public.
- Layers shown as greyed-out in the list do not display at the current zoom level. Zooming in further on the map will enable their display.
- Layers shown with an arrow
 indicate Parent/Child layers or Grouped layers. Click on the arrow to expand/collapse the grouping. indicate Parent/Child layers or Grouped layers. Click on the arrow to expand/collapse the grouping.
- Layers shown with a checkbox next to the arrow
 indicate Parent/Child layers. Turn on/off individual Child layers within that Parent/Child set, or turn on/off the Parent as a whole set. Individual Child layers work together to comprise the entire Parent set. indicate Parent/Child layers. Turn on/off individual Child layers within that Parent/Child set, or turn on/off the Parent as a whole set. Individual Child layers work together to comprise the entire Parent set.
- Layers shown with a solid box next to the arrow
 indicate Grouped layers. Layers within the Grouped layer are subset layers or independent themes that do NOT work together, and can be turned on/off seperately. indicate Grouped layers. Layers within the Grouped layer are subset layers or independent themes that do NOT work together, and can be turned on/off seperately.
|
|
Top
|
|
|
|
|
|
|
The Legend tab allows viewing of the current map legend.
When any layer is turned on, the legend updates immediately to show the map layers that are currently displayed.
|
|
Top
|
|
|
|
|
|
|
The Measure tab allows performing measurements on the map.
- Three types of measurements are available:
- Area - Measures the area inside a closed polygon
- Distance - Measures a distance along a line or polyline
- Location - Displays latitude / longitude of your cursor location, and of a point placed on the map
- Select a measure type button
 . This will enable the measure tool showing the button as highlighted . This will enable the measure tool showing the button as highlighted  . .
- A single click on the map starts the measurement. Additional single clicks will add more points along an area boundary or polyline.
Double click to complete the measurement.
- The units of measure can be changed interactively while performing a measure, or after the measurement is complete.
Simply choose the unit drop-down
 , and select a different unit of measure. , and select a different unit of measure.
- Layer popups are disabled while the measure tool is enabled.
TIP: The different measure type buttons are toggle buttons. This means you will stay in measure mode until you un-toggle the button, so be sure to un-toggle the measurement button when you're finished.
|
|
Top
|
|
|
|
|
|
|
The Print tab allows printing the current map, by creating a print-ready PDF document.
- Choose your desired print options from the Print tab, then select the Print button.
- This will generate a hyperlink in place of the Print button, pointing to the resulting PDF Printout document.
- You can print and / or save the PDF document.
Note: This web map does NOT support printing Google basemap layers from the Print tab, and will show an empty background when Google basemaps are printed.
However, any basemap can be printed using the browser print tools, but you may need to modify the browser print options to get your map to fit the page.
|
|
Top
|
|
|
|
|
|
|
The Search tab allows searching for a record or a group of records for various map layers.
- Select a search type from the drop-down list.
- Then select or enter your search criteria in the next box(es).
- Then hit the Search button.
- Search results appear in multiple locations:
- Graphic search results appear on the map in bright red
- Tabular search results appear in the Search Results table at the bottom of the page
- The total number of results returned from the search displays in the control panel below the search button
- The Search Results table is sortable on each column in either ascending or descending order, by clicking on the column header.
- Each row in the Search Results table is clickable, which zooms you to that record on the map.
- Tabular Search Results can be exported to a CSV (comma separated values) file, by selecting the Export to CSV button.
TIP: Start typing in the drop-down boxes for quick filtering.
TIP: Enter only the first few letters in a text box, then perform your search. This will eliminate the chance for spelling errors by allowing you to pick from a short list of matches in the search results table.
TIP: To re-format raw date fields in an exported CSV file, use the following formula in Excel, and format the resulting field as a date format: =(A1/86400000)+25569+(-5/24) (where A1 represents the exported date cell)
The Clear Search button clears the bright red search results from the map and clears the tabular list from the search results table.
|
|
Top
|
|
|
MAP: The Map frame contains the map and several icons in the upper right corner to perform special functions.
|
-
 Zoom In - Click on this icon to zoom in on the map. The mouse wheel also zooms in/out on the map. Zoom In - Click on this icon to zoom in on the map. The mouse wheel also zooms in/out on the map.
-
 Zoom Out - Click on this icon to zoom out on the map. The mouse wheel also zooms in/out on the map. Zoom Out - Click on this icon to zoom out on the map. The mouse wheel also zooms in/out on the map.
-
 Default Extent - Click on this icon to pan and zoom your map back to the default extent. Default Extent - Click on this icon to pan and zoom your map back to the default extent.
-
 Find My Location - Click on this icon to display your current location on the map. This uses location based services to perform the task, and can be very useful in the field. Find My Location - Click on this icon to display your current location on the map. This uses location based services to perform the task, and can be very useful in the field.
-
 Google Street View - Click on this icon to activate Google Street View. You will be prompted to click a point on the map, which defines the location for Street View, or you can click the Cancel button to quit.
TIP: Clicking on property, close to street works best, because the tool uses the property address point location. Google Street View - Click on this icon to activate Google Street View. You will be prompted to click a point on the map, which defines the location for Street View, or you can click the Cancel button to quit.
TIP: Clicking on property, close to street works best, because the tool uses the property address point location.
-
 Tutorial - Click on this icon to open the tutorial document. Tutorial - Click on this icon to open the tutorial document.
|
|
|
|
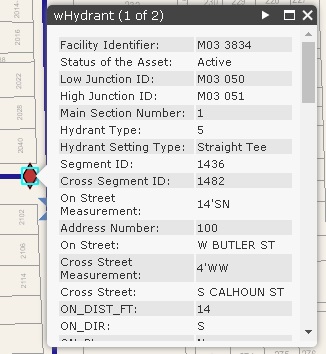
The map itself can also be clicked, and certain map layers will display a popup box showing data about that particular layer and location.
If an arrow  appears in the upper right corner of the popup, this indicates multiple layers were clicked,
and multiple popup boxes are available. Click the arrows to advance through multiple popup boxes.
A layer name is also shown in the upper left corner appears in the upper right corner of the popup, this indicates multiple layers were clicked,
and multiple popup boxes are available. Click the arrows to advance through multiple popup boxes.
A layer name is also shown in the upper left corner  indicating which layer's data is currently shown. indicating which layer's data is currently shown.
|
|
Top
|
|
SEARCH RESULTS: The Search Results frame displays a tabular list of the search results, created from the Search tab.
|
- Sortable - each field in the search results table is sortable (ascending and descending) by clicking on the column header.
- Clickable - each record or row in the search results table is clickable, and when clicked will zoom the map to the location of that record.
The sortable and clickable nature of the table makes it very useful for quickly finding a particular record in a dataset, and quickly navigating
to the matching location on the map.
|
|
Top
|
|
HOW TO SCENARIOS: Below are links to several how to scenarios, showing examples of how to perform certain tasks.
|
- Scenario #1 - How do I search for an address, and view the install date of a water main at that location?
- Scenario #2 - How do I search for an intersection, and view the Street View for that area?
- Scenario #3 - How do I search for a hydrant and print a map of the water facilities in that area?
- Scenario #4 - How do I search for a street and identify the address points in that area, along with the water service area at that location?
- Scenario #5 - How do I perform a Water - Isolation Trace, and export the customer data for that extent?
|
|
Top
|
|